Your Food Is Made of Fossil Fuel
This is the part most people don't understand about modern agriculture: food is not made from soil and sunlight. Food is made from natural gas and diesel.
Every branch of this tree is affected when Hormuz closes.
The Haber-Bosch process — the industrial reaction that turns natural gas into synthetic nitrogen fertilizer — consumes roughly 2% of all global energy and 3-5% of global natural gas output. It is arguably the most important chemical process in human history. Without it, the earth can support approximately 3.5 to 4 billion people. With it, we feed 8 billion.
48-50% of all humans alive today are fed exclusively by the Haber-Bosch process. This is not an estimate. It's a calculated figure from a landmark 2008 Nature Geoscience study by Jan Willem Erisman. Remove synthetic nitrogen from the equation, and approximately 4 billion people have no food source.
On top of the fertilizer, every step of the food chain runs on diesel: planting (tractors), harvesting (combines), grain drying (propane/natural gas), trucking to elevators, rail to processors, refrigerated trucks to stores. US farm fuel expenditure was $15.4 billion in 2023, with diesel alone accounting for $9.9 billion (64%).
The systemic reality, calculated by David Pimentel at Cornell: for every 1 calorie of food on your plate, about 10 calories of fossil fuel were burned to get it there. At the farm gate, grains are actually energy-positive (1 unit of fossil fuel yields 3-4 calories of grain). But by the time you add processing (36% of food-system energy), transport, packaging, refrigeration, and cooking, the ratio inverts dramatically.
- Producing 1 kg of beef takes the fossil energy in about a gallon of crude oil (~40,000 kcal)
- Most of it goes to growing and moving the feed
- Source: Pimentel, Cornell
- Put in 1 unit of fossil fuel, get 3-4 units of grain energy back
- The plant itself is a net solar accumulator
- It's everything AFTER the farm that erases that gain
- For corn and wheat specifically
- When natural gas spikes, this number explodes
- Source: USDA ERS
- US on-highway average, July 6 2026 (EIA)
- Down from the ~$5.40 spring peak as crude eased
- Still a tax on every mile of the food chain
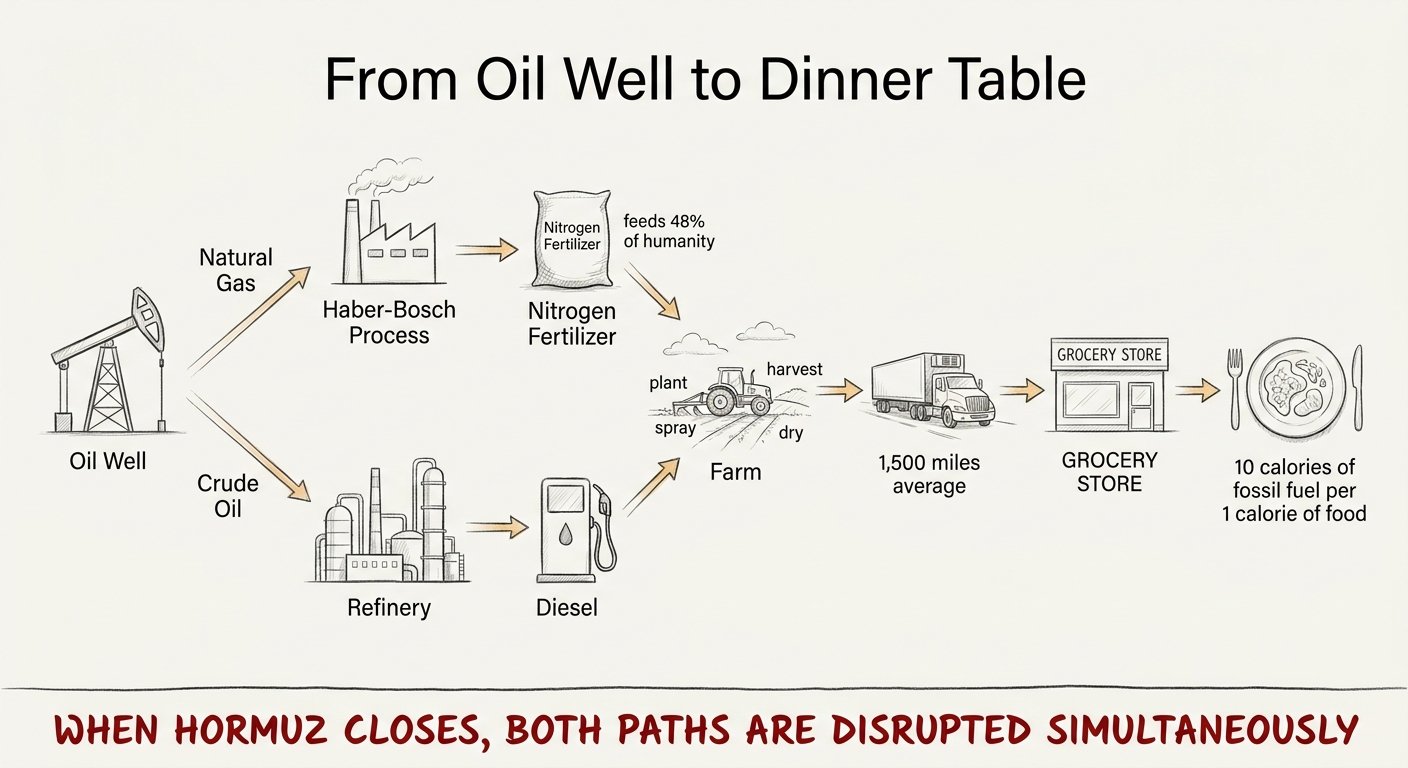
Two paths from fossil fuel to food. Both run through Hormuz.
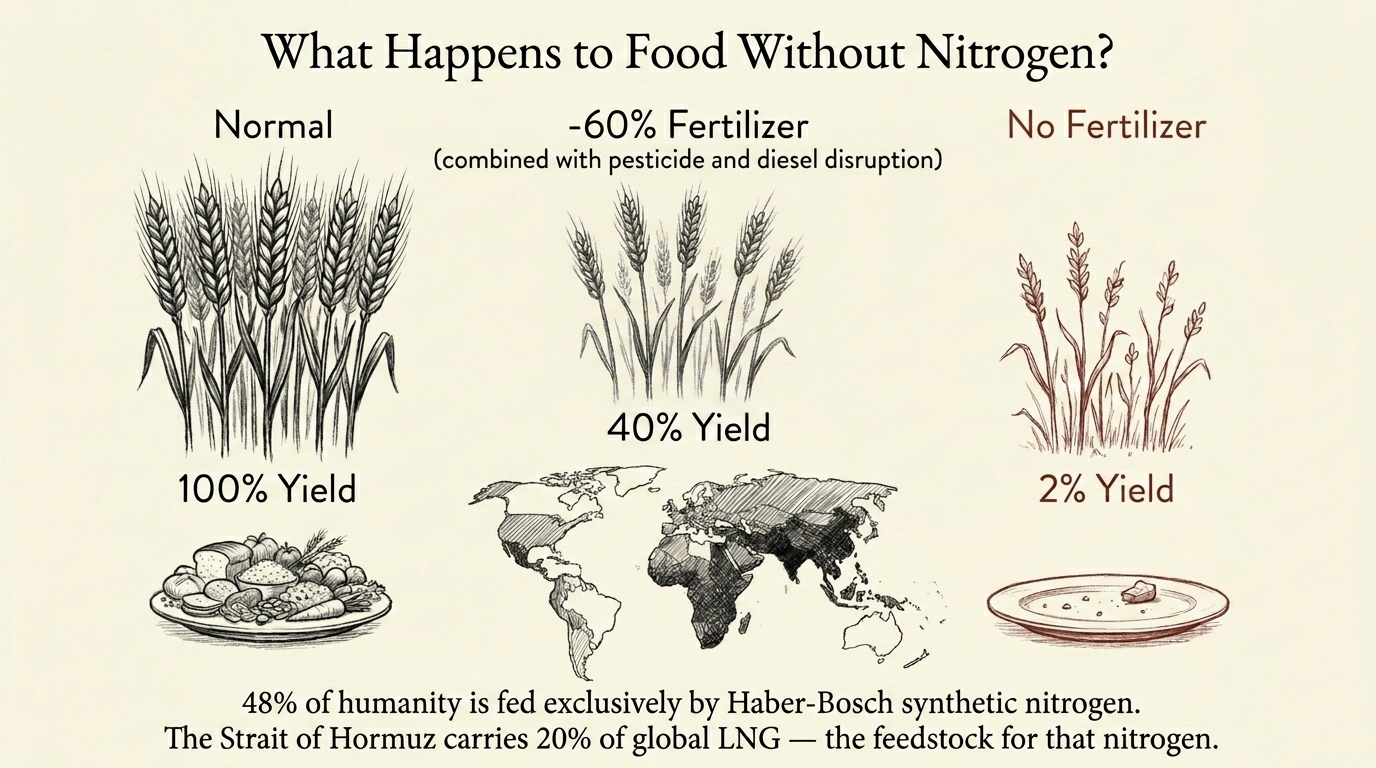
48% of humanity is fed by the Haber-Bosch process. Remove synthetic nitrogen and cereal yields crash 40-60%.
What the Strait of Hormuz Actually Carries
When people hear "Hormuz," they think oil. That's only half the problem.
| What Transits Hormuz | Volume | Share of Global | Why It Matters for Food |
|---|---|---|---|
| Crude Oil | ~21 million bpd | 21% of global | Sets global diesel price. Diesel runs the entire farm-to-table chain. |
| LNG (Natural Gas) | Major volumes from Qatar/UAE | ~20% of global LNG trade | Natural gas = fertilizer feedstock. No gas, no nitrogen, no yields. |
| Seaborne Urea | From Qatar, Saudi, Oman | ~50% of global seaborne exports | Urea is the most widely used nitrogen fertilizer globally. |
| Seaborne Ammonia | From Middle East producers | ~30% of global seaborne exports | Ammonia is the base chemical for all nitrogen fertilizers. |
Alternative routes can't compensate. Saudi Arabia's East-West Pipeline and the UAE's Habshan-Fujairah pipeline together max out at 6-8.5 million bpd. With normal Hormuz transit at 21 million bpd, a full closure leaves a 12-14 million barrel per day unmitigated global shortfall. And for LNG, there are zero pipeline alternatives.
Current Status (updated July 8, 2026)
This is a live situation and the numbers move. Here's where it actually stands now — and where it stood at the spring peak, because that's the stress test the rest of this page walks through.
The acute closure has eased, but the strait is not back to normal. After the US-Israel air war on Iran that began February 28, Iran plus a US naval counter-blockade shut Hormuz down — commercial traffic fell more than 95%, and at the worst point only a handful of ships got through in a day. A ceasefire was announced June 14 and signed June 17 (the "Islamabad MOU"): a toll-free reopening, Iran to clear its mines, the US blockade lifted in step, and a 60-day nuclear-negotiation window.
As of today, roughly 34 ships a day are transiting — a real recovery off the spring lows, but still well below the ~83/day that's normal. Mines are the sticking point: the central channel is still mined, Iran has reportedly lost track of some of its own mines, and there have been fresh, sporadic attacks even after the deal. The Joint Maritime Information Center cut the threat level from "SEVERE" to "SUBSTANTIAL" — its first downgrade since the crisis began — but insurance, mine-clearance timelines, and idled infrastructure put full normalization months out, not days.
Markets calmed faster than the water did. Brent, which spiked to about $126 in April, is back near $73 — traders priced in the ceasefire well before the shipping lanes actually cleared. That gap, calm prices sitting on top of a still-disrupted chokepoint, is exactly the fragility this page is about. One clean re-escalation and the spring numbers come straight back. Sources: Wikipedia (2026 Strait of Hormuz crisis), Al Jazeera, Joint Maritime Information Center, market data — Jul 2026.
What's Already Happening to Prices
- Peaked around $126 in April
- Markets calmed once the June ceasefire was signed
- Physical flow through Hormuz still hasn't fully recovered
- Source: market data, Jul 2026
- Off ~5% from the spring peak, still far above pre-conflict
- The most widely used nitrogen fertilizer on earth
- Source: DTN fertilizer data, Jun 2026
- Above the spring's ~$1,050; was ~$800 pre-conflict
- AFBF: 70% of US farmers can't afford all the fertilizer they need this cycle
- Source: DTN / AFBF
- FAO Food Price Index at 130.3 (100 = the 2014-16 average), June 2026 — up 2.2% year-on-year
- Edged down 0.3% in June as grain harvests came in
- Energy shocks reach the grocery store on a lag
- Source: FAO
The worst of it landed during spring planting season. Through April and May, with fertilizer and diesel spiking, farmers altered their crop mixes — shifting from nitrogen-heavy corn toward soybeans, which fix their own nitrogen. Those decisions are already baked into this autumn's harvest. At the peak, grain shipping was getting hammered at the other end too, with oil tankers outbidding grain carriers for scarce transit slots and freight rates jumping. As the strait reopens those shipping pressures are easing — but the crop choices farmers made under crisis prices don't un-make themselves.
Food prices move on a lag — that's the part most people miss. Energy and fertilizer spike first; the grocery bill catches up months later, and it never falls as fast as it rose. Even as the acute crisis eases, the FAO index above is still near the top of its post-2022 range, because spring's fertilizer costs are still working their way through this year's crops. Wheat and maize actually came DOWN in June on strong Black Sea and South American harvests — a reminder that supply, not just chokepoints, still gets a vote.
This Has Happened Before. Here's What Followed.
| Crisis | Energy Trigger | Food Impact | Human Cost |
|---|---|---|---|
| 2008 Oil Spike | Brent hit $147/bbl | FAO Food Price Index crossed 210. Corn diverted to ethanol. | 60+ food riots in 30 countries |
| 2011 Arab Spring | Energy + drought compound | FAO hit all-time high of 230+ | Governments fell in Tunisia, Egypt, Libya. Triggered by bread prices. |
| 2022 Russia-Ukraine | Russia: top fertilizer exporter. 30% of global wheat. | FAO hit 159.7 (new record). 70% of European ammonia capacity shut down. | Sri Lanka collapsed. Sub-Saharan Africa acute food crisis. |
| North Korea 1991 | Soviet fertilizer subsidies ended | Grain production dropped 30% immediately | Famine killed 240,000 to 3.5 million (out of 22M population) |
| Sri Lanka 2021 | Government banned chemical fertilizers | Agricultural output collapsed within one season | Economic collapse, government fell, IMF bailout |
The NECSI threshold: Researchers at the New England Complex Systems Institute found that when the FAO Food Price Index crosses 210, widespread violent riots and political instability predictably follow. This threshold held in both 2008 and 2011. The current reading is 130.3 (June 2026) — still roughly 61% below the instability line, and with the ceasefire it has stopped climbing for now. But if the strait re-closes through Q3, planting disruption plus harvest reduction could push the index back toward that zone by Q1 2027. Source: NECSI, 2011; FAO, Jun 2026
What Happens Next: Two Scenarios
These were the projections at the height of the closure. The June ceasefire has, for now, taken them off the base case — treat them as the “if it re-escalates” map, not a forecast. Given how fast markets snapped back on a fragile, still-mined reopening, they're worth keeping in view.
6-Month Closure (through August 2026)
Energy: EIA projects Brent averaging $115/bbl. European TTF natural gas reaches crisis levels by autumn as winter storage fails to fill without Qatari LNG.
Food: Missing the 2026 fertilizer application window guarantees a 10-20% yield reduction in global cereals by autumn harvest. Food price inflation hits severe levels by Q4 2026 / Q1 2027 as physical shortage replaces speculative pricing.
12-Month Closure (through February 2027)
Reserves: US SPR faces dangerous depletion at current 4-8.5M bbl/week drawdown. Global grain reserves — currently at 31.9% of consumption (about 3.5 months) — begin synchronized collapse.
Famine: The global food system operates just-in-time. A 12-month fertilizer deficit translates into multi-year famine conditions in developing nations that cannot outbid wealthy countries for remaining caloric reserves. Sub-Saharan Africa, Pakistan, Bangladesh, and Egypt are the most exposed.
Who Gets Hit and Who Doesn't
| Region | Exposure | Why |
|---|---|---|
| United States | Low (domestic energy) | Domestic natural gas cheap ($2.71-2.79 Henry Hub). Domestic food production. But diesel stays high because crude is globally priced. Grocery inflation via transport costs, not production collapse. |
| Europe | High | Decoupled from Russian gas, now losing Qatari LNG. Russia simultaneously cutting Kazakh oil pipeline to PCK refinery (90% of Berlin's fuel) — timed for maximum pain. Jet fuel refining capacity covers only 70% of airline demand; 50 days reserves drop to crisis by June. Domestic fertilizer production at risk of 2022-style shutdowns. |
| Pakistan / Bangladesh | Critical | Nearly 100% dependent on Hormuz-transit LNG. Cannot afford spot-market replacement. Facing rolling blackouts and fertilizer production stalls. |
| Egypt / MENA | Critical | Massive net wheat importers. Food prices directly correlate with regime stability in this region. 2008 and 2011 bread riots are the precedent. |
| Sub-Saharan Africa | Catastrophic | Smallholder farmers cannot absorb $900+/ton ammonia. They simply stop applying fertilizer. Yield collapse and localized famine within the same calendar year. |
| Caribbean / Haiti | Catastrophic | Haiti's grid runs on imported diesel generators. Priced out of spot market — rolling national blackouts, loss of water purification, communications dark zones. Cuba: severe blackouts from Venezuelan oil blockade + US sanctions. |
| Pacific Islands | Catastrophic | Spend up to 25% of GDP on fuel imports. Samoa 2/3 diesel-dependent, Tonga 80%. Fuel imports dropped to 25% of normal. Fishing fleets confined to port. Outer island communities cut off from food and medical supplies. |
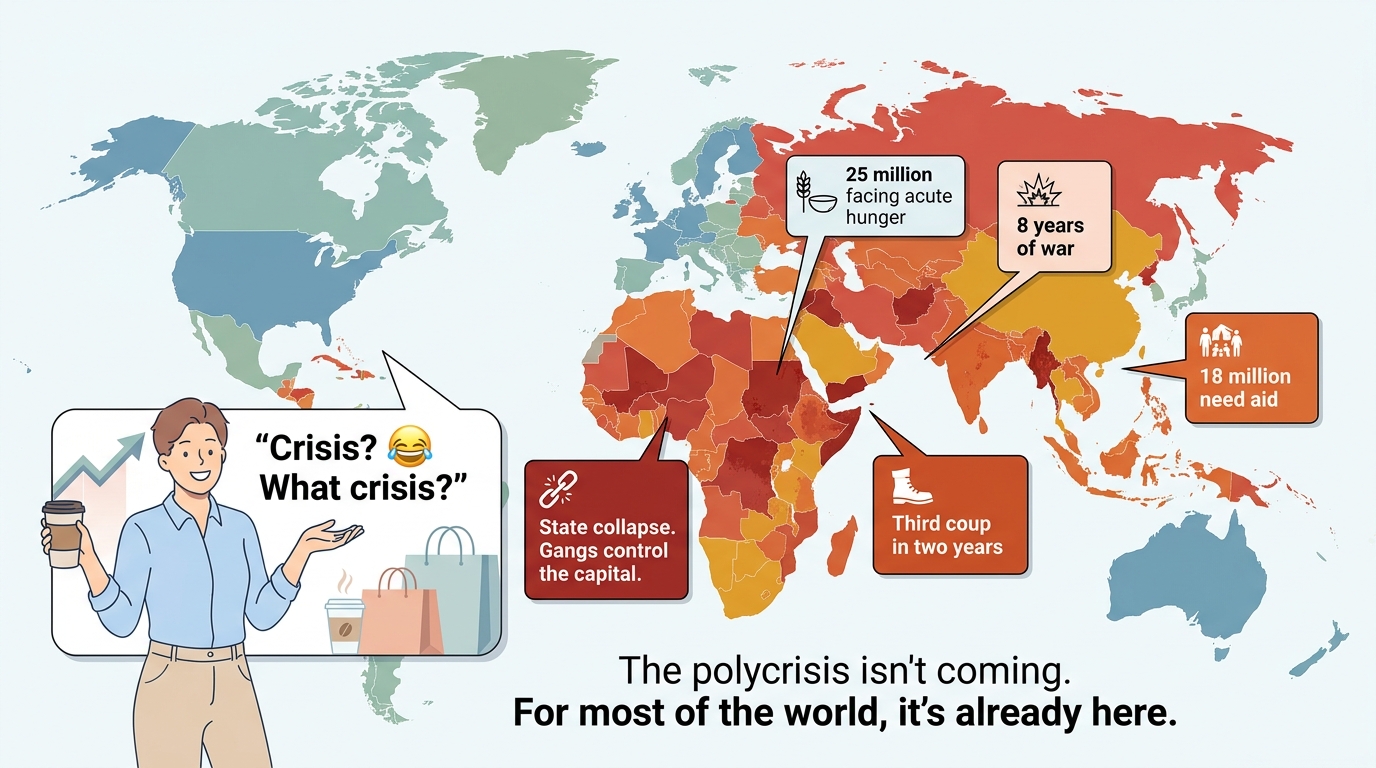
For much of the world, this isn't a forecast. It's already here.
WFP Red Alert (spring 2026 peak): At the height of the closure, the World Food Programme faced a double-bind: the cost of procuring food aid has spiked from fertilizer/pesticide input costs, while the cost of shipping it via diesel-powered trucks and maritime freight has simultaneously doubled. Ration cuts to existing refugee populations are probable by May 2026. Several frontier markets are experiencing balance-of-payment crises, triggering emergency IMF financing requests.
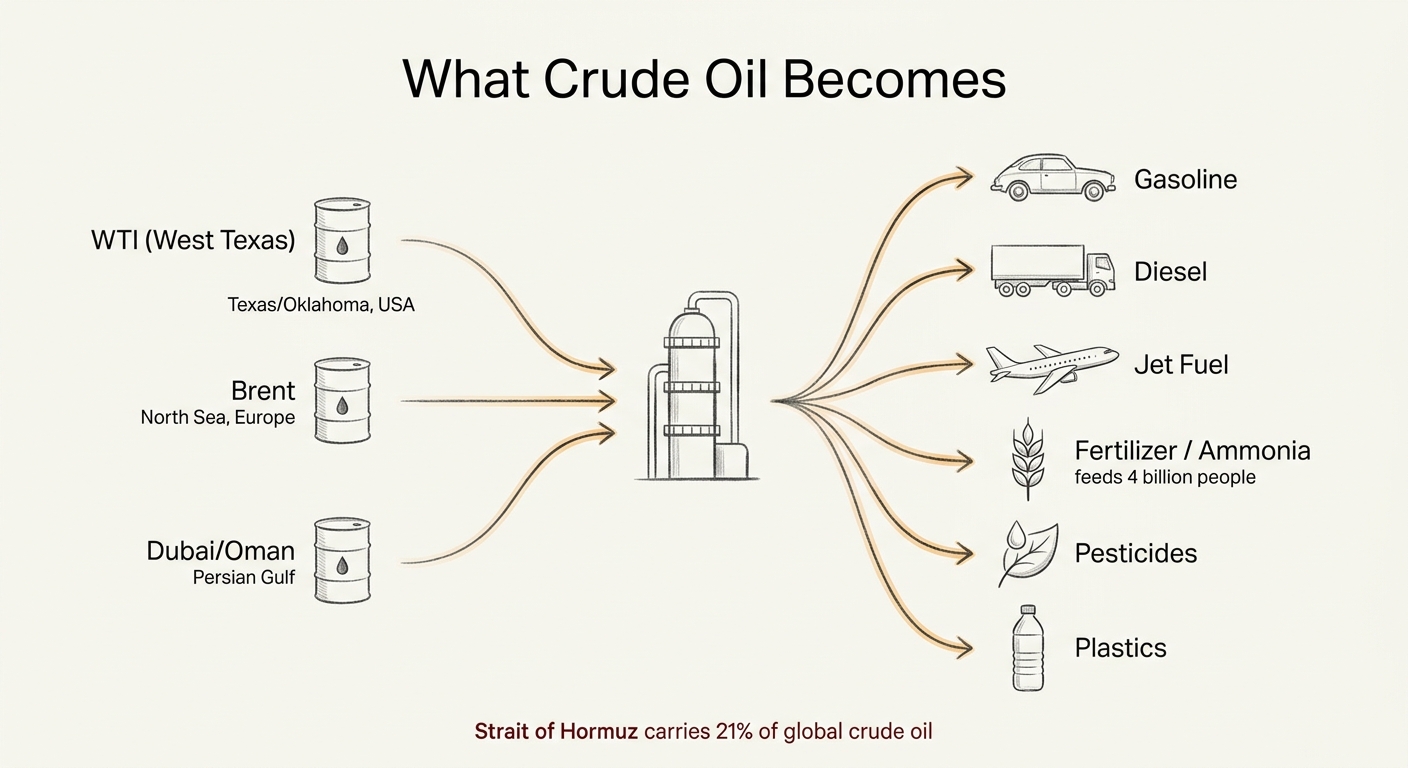
It's Not Just Fuel and Fertilizer
When people think "oil crisis," they think gasoline. But a barrel of crude becomes far more than fuel. A standard 42-gallon barrel yields roughly 45 gallons of refined products: 45% gasoline, 30% diesel, 10% jet fuel — and then the rest becomes the invisible backbone of modern civilization.
Plastics (99% petroleum-derived)
The world produces 460 million metric tons of plastic annually. 4-8% of global oil consumption goes directly into plastic production. The healthcare system is almost entirely dependent on petroleum plastics: 300 billion medical gloves, 129 billion face masks, and 17 billion IV bags per year — all made from polypropylene and PVC derived from crude oil. When resin prices spike, hospital overhead spikes with them. Food packaging (PE, PET) is equally petroleum-derived — if packaging becomes scarce, perishable food spoils faster, compounding the food crisis.
Pesticides (99% petroleum-derived)
Beyond the active chemical ingredient, 50-75% of the volume of commercial pesticides (like glyphosate) consists of petroleum-derived "inert" ingredients: distillates, surfactants, solvents, and microplastic coatings. The compound effect with fertilizer is devastating: without affordable pesticides, crop losses to insects and blight compound by 20-40% within a single growing season. Fertilizer makes crops grow. Pesticides keep them alive. Hormuz threatens both simultaneously.
Pharmaceuticals
99% of pharmaceutical feedstocks and reagents are petrochemical. Benzene, toluene, and xylene are the foundational building blocks for synthesizing antibiotics, analgesics (aspirin), and timed-release capsule coatings. While most finished APIs come from India and China, those countries manufacture them using chemical precursors derived from Gulf-sourced refined oil. A Hormuz disruption chokes the precursor chemicals at the source.
Helium (No Substitute Exists)
Qatar produces roughly one-third of global helium supply as a byproduct of natural gas extraction. Helium cannot be safely shipped by air — it must move by sea. With Hormuz blockaded, that supply is choked off. This isn't about party balloons. Helium has the lowest boiling point of any element and irreplaceable thermal conductivity. It cools the superconducting magnets in MRI machines, serves as a carrier gas in semiconductor chip fabrication (chemical vapor deposition), and purges clean rooms. There is no synthetic substitute for helium. If you run a hospital radiology department or a chip fab, you cannot swap it out for something else.
Everything Else
Naphtha — cracked from crude — becomes ethylene, propylene, and butadiene: synthetic rubber (tires), synthetic fibers (polyester clothing), adhesives, paints, and detergents. Every branch of the petroleum product tree is simultaneously affected by a crude supply disruption. This isn't an oil crisis. It's a materials crisis.
"Energy Independence" — How Insulated Is the US Really?
The US is a net exporter of total petroleum products. It produces 13.6 million barrels per day. So why are gas prices spiking?
The infrastructure mismatch: US shale produces "light, sweet" crude, but decades of US refinery infrastructure were built to process "heavy, sour" crude. The US exports its domestic light crude and imports 6.4 million bpd of heavy crude to feed its refineries. Canada supplies 62% of imports (4.1-4.4M bpd), with Mexico, Saudi Arabia, Iraq, and Colombia filling the rest.
The global pricing mechanism: This is the part that breaks the "independence" narrative. If Brent hits $106 due to a Middle East shortage, a Texas oil producer will not sell their oil domestically at $70. They'll put it on a tanker and export it to the highest global bidder. To keep that oil in the US, domestic refiners must pay the global $106+ rate — and pass that cost directly to the American consumer.
And shale won't save us. Despite White House pressure, US shale producers are refusing to increase output. The Dallas Fed's April energy survey shows operators taking a "do nothing" approach to 2026 budgets. This is rational: they can't commit billions to ramp production when prices swing wildly on presidential tweets, and they remember what happened when they overdrilled in 2014 and 2020. If they ramp up now and a sudden peace deal crashes prices tomorrow, they're left holding the bag. The administration has dispatched Interior Secretary Bergam to beg oil executives to drill — and Treasury Secretary Bessent has resorted to threatening gas station owners, the exact same move Biden tried in 2022. Turns out yelling at gas stations is a bipartisan tradition.
The bottom line: The US is genuinely insulated on natural gas (pipeline infrastructure, domestic abundance). It is not insulated on crude oil, diesel, jet fuel, or anything priced against global benchmarks. "Energy independence" is an infrastructure mismatch reality, not a strategic shield. And the one thing that could help — domestic shale production — isn't coming because the producers have learned that policy whiplash makes long-term capital planning impossible.
Why There's No Quick Fix
Green ammonia (made from renewable hydrogen instead of natural gas) currently costs 2-3x more than conventional ammonia ($700-1,000/ton vs $300-400/ton). The largest project in the world — NEOM in Saudi Arabia — won't produce its first commercial output until 2027.
Electric farm equipment exists only in low-horsepower models (<50 HP) for orchards and specialty crops. The high-horsepower combines and tractors that harvest corn and wheat need energy density that lithium-ion batteries cannot provide for 14-hour harvest days. Timeline: not in this decade.
Organic farming has a 20-25% yield gap versus conventional — exceeding 40% for nitrogen-hungry crops like corn and wheat. The world cannot feed 8+ billion people without synthetic nitrogen. Full stop.
Precision agriculture and AI-driven farming can reduce fertilizer waste by 10-20%. That's an optimization, not a replacement for the baseline nitrogen that biology requires.
There is no technology available today that replaces fossil fuel inputs to agriculture at the scale required. Every proposed alternative is either too expensive, too small, or too far away.
The Stock Market Thinks This Is Fine
While you read the facts above, the S&P 500 recently hit another record high. Equity traders appear to have decided that a shooting war in the world's most critical energy chokepoint is a buying opportunity.
But if you talk to the people who actually move physical barrels of oil, the mood is very different. There's a massive and growing disconnect between what equity markets are pricing (a swift diplomatic resolution) and what physical commodity markets are seeing (1.5 billion barrels of permanent supply loss and a 2030 recovery timeline).
This disconnect has structural causes:
- Muscle memory. Every market correction since 2008 was met with a rescue. Every dip was followed by new highs. A generation of traders has been trained that drawdowns are buying opportunities because someone always backstops. Investors assume a "TACO" scenario — Trump Always Chickens Out — expecting the same retreat as the 2025 tariff reversal.
- The fatal flaw: A trade war is fought with administrative ink. You can cancel a tariff with a social media post. A shooting war is fought with drones, naval barricades, and anti-ship missiles. You cannot unilaterally back down when the other side has its own agenda. Iran has discovered that holding the global economy hostage is leverage they can actually use. It takes two to TACO.
- Passive flows don't think. 60-70% of equity volume is passive/index trading. That money responds to payroll deductions hitting 401(k)s every two weeks, not geopolitics. As long as the flows continue, prices go up mechanically, regardless of what's happening in the Strait.
- The valuation trap. In 1978, when the last major oil shock hit, the S&P 500's price-to-earnings ratio was at historic lows. There was room to absorb a shock. Today, valuations are stretched to near-record highs, supported by a private credit market that didn't exist in the 1970s. The economy needs less oil per dollar of GDP (oil intensity down 70% since the 1970s), but the financial system has a much lower margin of safety for a prolonged inflation shock.
The good news: the oil intensity of the global economy has declined over 70% since the 1970s. Factories are more efficient, cars get better mileage, power grids have diversified. The physical economy is more resilient. But the financial economy is standing on much shakier ground. And in Asia, the crisis is accelerating the transition to energy sovereignty — EVs now make up over 50% of new car sales in China and 40% in Southeast Asia.
Physical reality has always eventually caught up with financial optimism. The question is when, not whether.
The Bottom Line
Sources
USDA Economic Research Service (crop costs, food dollar, farm expenditures) · FAO Food Price Index · EIA (energy transit, price data, SPR) · Jan Willem Erisman et al., Nature Geoscience 2008 (Haber-Bosch population dependency) · David Pimentel, Cornell University (food-energy ratios) · Vaclav Smil (energy and agriculture systems) · NECSI (food price instability threshold, 2011) · BIS (credit-to-GDP, debt service ratios) · DTN fertilizer market data · Purdue University agricultural macro models · NEOM Green Hydrogen Project data · IEA (global energy transit data) · Patrick Boyle (physical commodity analysis, Apr 2026) · Paul Krugman (valuation fragility comparison) · Daniel Yergin/OddLots (disruption scale) · Trafigura (1.5B barrel loss estimate) · Dallas Fed energy survey (shale production refusal) · American Farm Bureau Federation (fertilizer affordability survey) · Kepler/Economist (European jet fuel modeling) · Brad Setser/Council on Foreign Relations (capital flow analysis)
Related: Crisis Monitor Dashboard | AI vs Jobs | Why You Can't Trust AI Commentary
When the Next Chokepoint Blows Up, Get the Read That Isn’t Panic
Oil, food, capital flows — when a crisis hits a pressure point in the global system, I walk through what it does to prices and what it doesn’t. Signal, not headlines.